Excel Forensic Analysis with tidychain
The Forensic Opportunity
Every Excel file contains a hidden audit trail. When you create a formula, Excel records it in calcChain.xml in creation order—and this order never changes, even when you move rows.
This technique was demonstrated by Data Colada #109, which revealed data fabrication in academic research by analyzing calcChain anomalies.
<calcChain>
  <c r="A1" i="1"/>  <!-- Created 1st -->
  <c r="A2"/>        <!-- Created 2nd -->
  <c r="A3"/>        <!-- Created 3rd -->
</calcChain>
If you move row 3 to row 1, the calcChain stays the same. The formula’s creation position is preserved, revealing the manipulation.
Complete Forensic Workflow
Step 1: Parse the Workbook
library(tidychain)
library(dplyr)

xlsx <- parse_xlsx("nist_financial_model.xlsx")
xlsx
── Excel Workbook Summary ──────────────────────────────────────────────────────
File: 'nist_financial_model.xlsx' (217.5 KB)
Created: "2000-12-08T14:09:03Z" by "(undefined Excel user)"
Modified: "2023-03-24T15:43:31Z" by "Parcell, John H. (Ctr)"
Sheets: 13 (1 hidden)
Cells: 19505 | Formulas: 4824
── Forensic Flags ──
! 1 hidden sheet(s)
! Hidden rows/columns detected
! 3 external link(s)
! 2847 late addition(s) in calc chainThis 23-year-old NIST financial model shows several forensic flags: a very hidden sheet (Module1), hidden rows/columns, 3 external links, and 2,847 late additions (46% of formulas created “out of order”).
Step 2: Examine the Calculation Chain
summary(xlsx@chain)── Calc Chain Summary ──
Formula cells tracked: 6142
Sheets covered: 7
! Late additions: 2847 (46.4%)head(xlsx@chain@chain, 10)# A tibble: 10 × 7
order cell_ref row col col_num sheet_id sheet_name
<int> <chr> <int> <chr> <int> <chr> <chr>
1 1 F154 154 F 6 12 Depreciation Schedule
2 2 G154 154 G 7 12 Depreciation Schedule
3 3 H154 154 H 8 12 Depreciation Schedule
4 4 I154 154 I 9 12 Depreciation Schedule
5 5 J154 154 J 10 12 Depreciation Schedule
...The first formulas created (order 1-10) are in row 154. This means row 154 was the original starting point, and rows 1-153 were added above it over time.
Step 3: Detect Anomalies
anomalies <- detect_anomalies(xlsx)
head(anomalies)
# A tibble: 6 × 9
sheet_name cell_ref row col col_num calc_order expected_order order_diff anomaly_type
<chr> <chr> <int> <chr> <int> <int> <int> <int> <chr>
1 Depreciation Schedule F154 154 F 6 1 2641 -2640 moved_down
2 Depreciation Schedule G154 154 G 7 2 2642 -2640 moved_down
3 Depreciation Schedule H154 154 H 8 3 2643 -2640 moved_down
...| Column | Meaning |
|---|---|
calc_order |
When the formula was created (1 = first) |
expected_order |
Where it should be if rows were sequential |
order_diff |
The discrepancy |
anomaly_type |
moved_up (created later) or moved_down (created earlier) |
Step 4: Summarize Anomalies
summary_result <- summarize_anomalies(anomalies, xlsx)
print(summary_result)
── Anomaly Summary ──
ℹ Severity: high
Total anomalous cells: 134760
── By Sheet ──
# A tibble: 7 × 2
sheet_name n
<chr> <int>
1 Depreciation Schedule 71691
2 Assumptions Processing 18438
3 CashFlow 16086
4 Income Statement 13293
5 Balance Sheet 11529
6 Control Panel 3717
7 Overview 6
── By Type ──
# A tibble: 2 × 2
anomaly_type n
<chr> <int>
1 moved_up 68770
2 moved_down 65990
── Row Clusters ──
Groups of consecutive rows that may have been moved together:
# A tibble: 70 × 4
sheet_name start_row end_row n_cells
<chr> <int> <int> <int>
1 Depreciation Schedule 4 4 437
2 Depreciation Schedule 11 16 2760
...Visualizing Anomalies
Plot 1: Creation Order vs Row Position
plot_calc_order(xlsx, sheet = "Income Statement")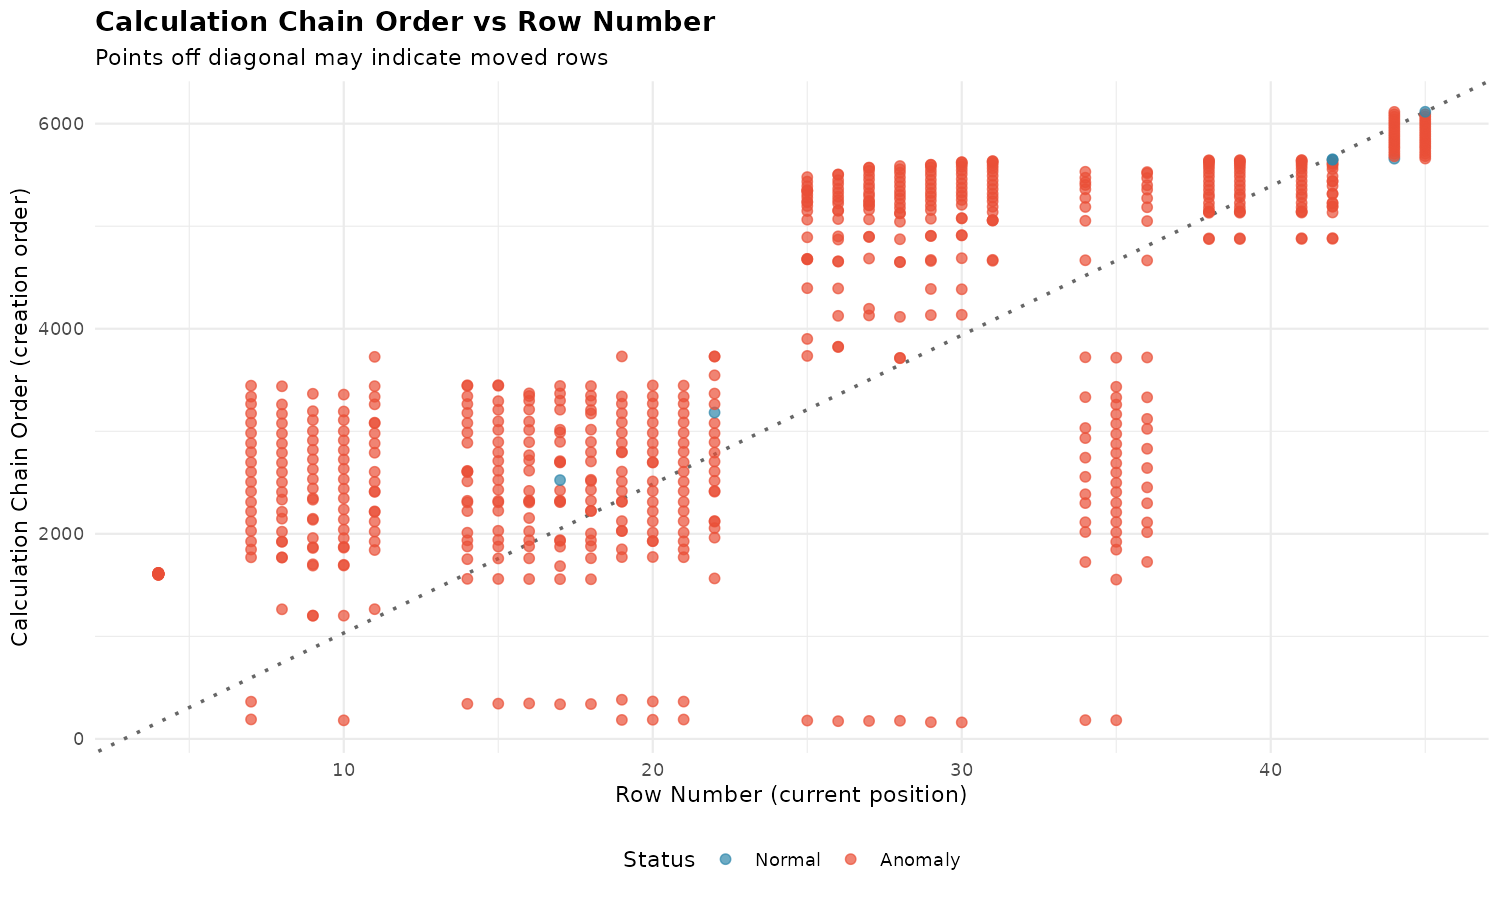
- X-axis: Current row number
- Y-axis: Creation order (position in calcChain.xml)
- Dotted diagonal: Expected pattern if rows were created top-to-bottom
- Blue points: Normal cells
- Red points: Anomalies
Interpretation:
- Points above the line: created later than row position suggests (inserted)
- Points below the line: created earlier than row position suggests (moved down)
- Scattered pattern: extensive editing over time
Plot 2: Sheet Heatmap
plot_sheet_heatmap(xlsx, sheet = "Income Statement")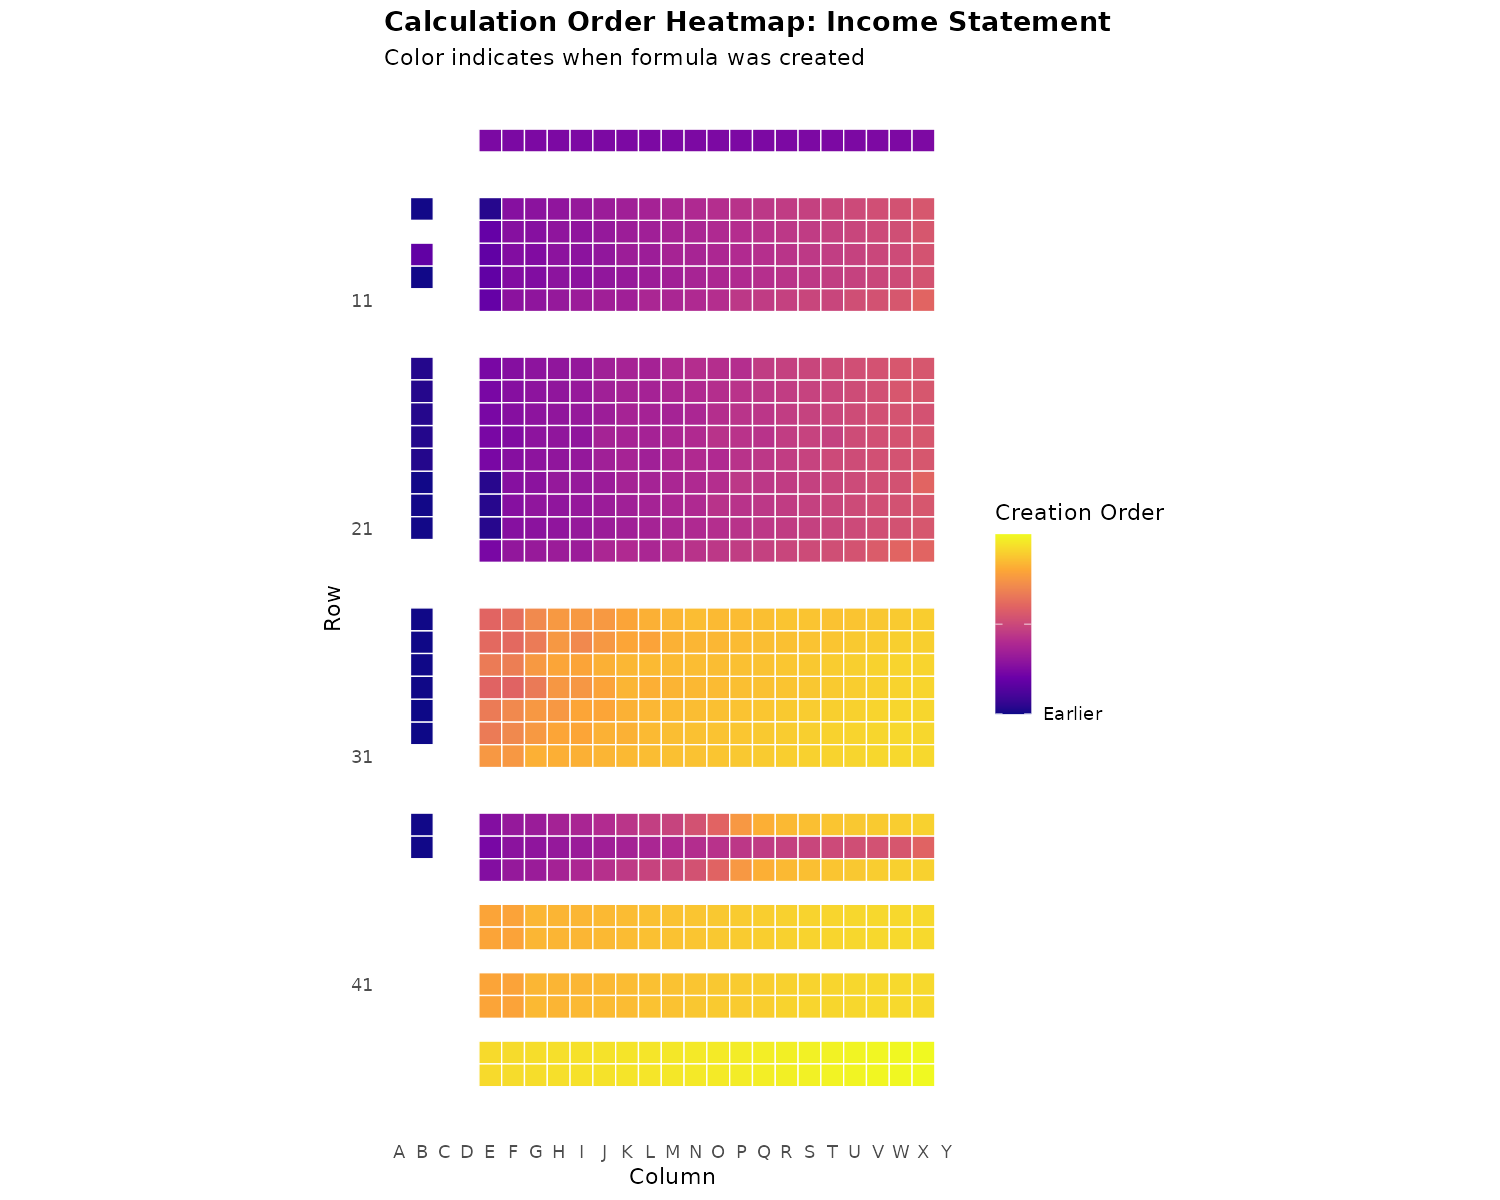
- Each tile = one formula cell
- Purple (dark): Created earlier
- Yellow (light): Created later
- Position shows current location in spreadsheet
What to look for:
| Pattern | Interpretation |
|---|---|
| Horizontal color bands | Rows created together |
| Color discontinuities | Rows inserted or moved |
| Yellow cells in purple region | Late insertions (suspicious) |
| Gradual top-to-bottom gradient | Normal sequential creation |
Plot 3: Anomaly Locations
plot_anomalies(xlsx, anomalies, sheet = "Income Statement")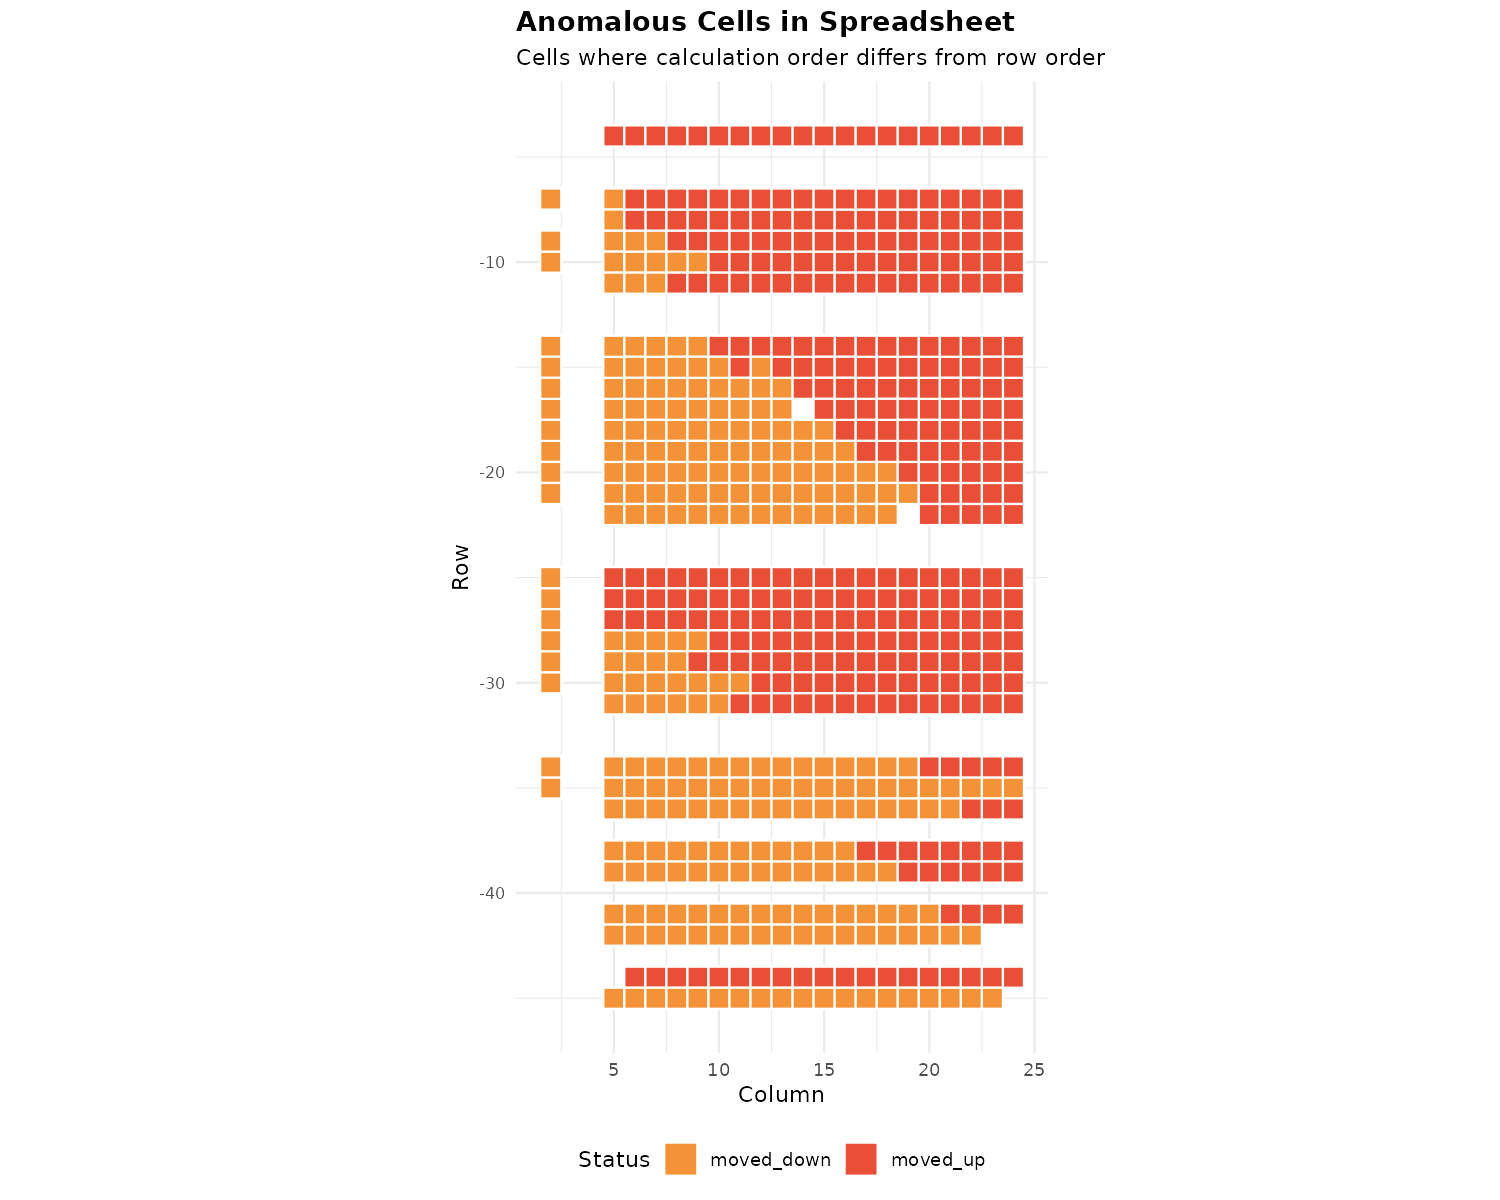
Red = moved_up (created after cells below it). Orange = moved_down (created before cells above it). Clusters indicate groups moved together.
Plot 4: All Sheets Overview
plot_calc_order(xlsx) # No sheet filter = all sheets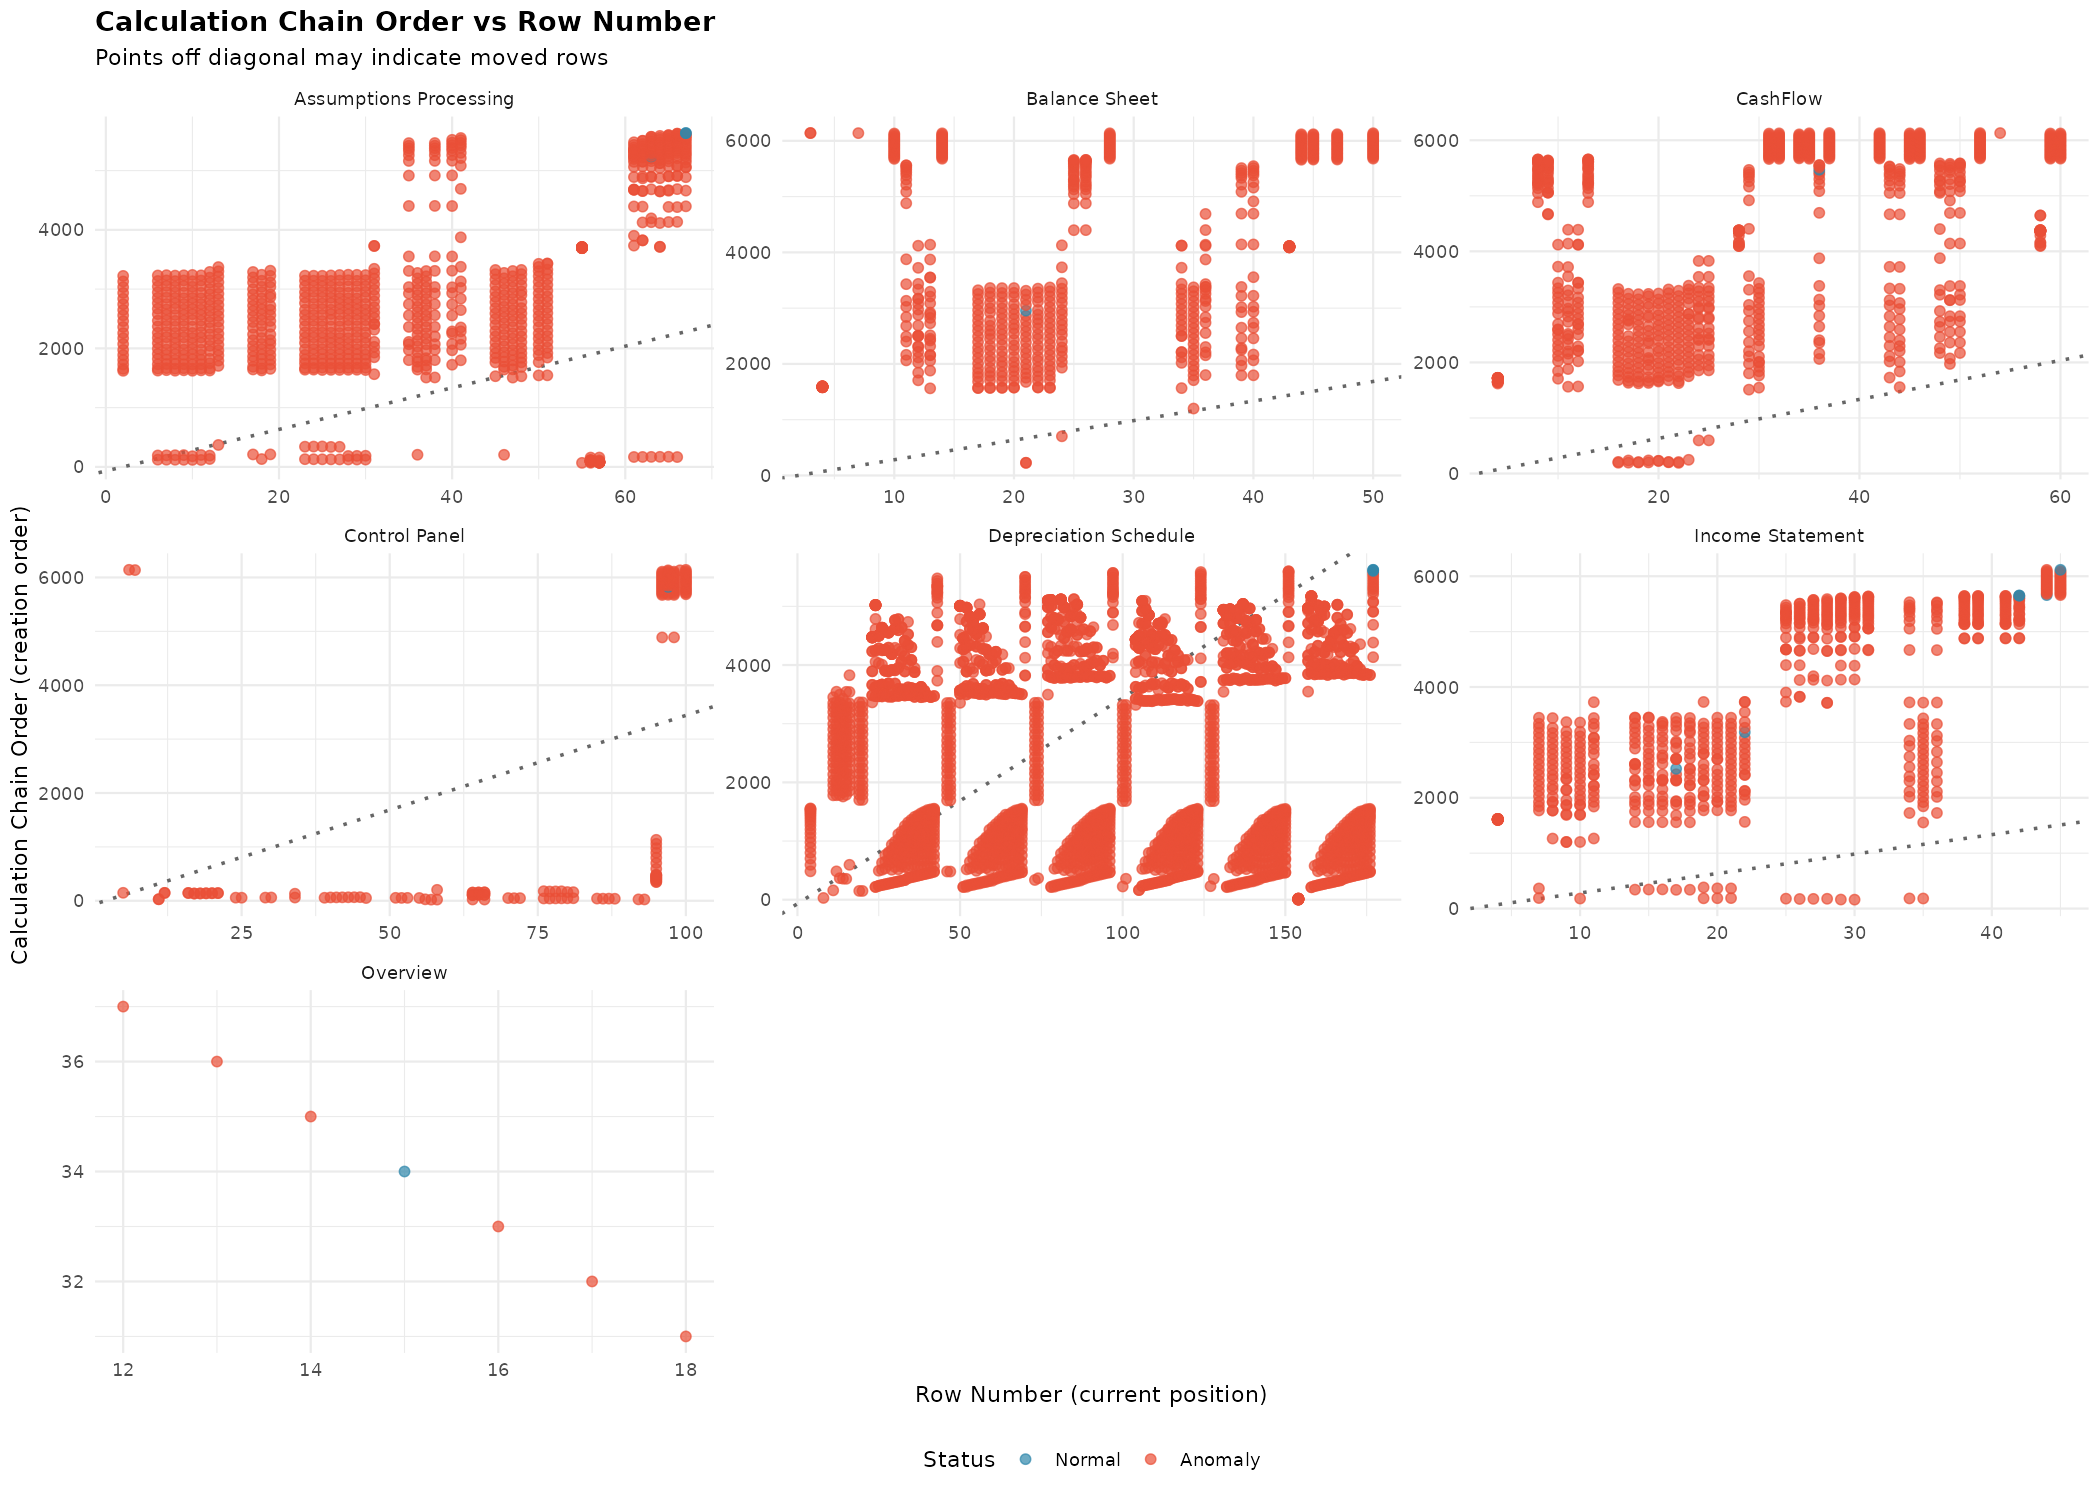
Compare editing patterns across sheets. Heavy editing appears as scattered points; minimal editing shows a clean diagonal.
Building a Timeline
timeline <- build_timeline(xlsx)
head(timeline)
# A tibble: 6 × 10
creation_order cell_ref sheet_name row col formula order_vs_row is_late_addition
<int> <chr> <chr> <int> <chr> <chr> <int> <lgl>
1 1 F154 Depreciation 154 F 'Assum… -2640 FALSE
2 2 G154 Depreciation 154 G 'Assum… -2640 FALSE
...Filter to late additions:
late_additions <- timeline |> filter(is_late_addition)
nrow(late_additions)
[1] 2847Print a formatted summary:
print_timeline_summary(timeline)── Formula Creation Timeline ──
File created: 2000-12-08T14:09:03Z
File modified: 2023-03-24T15:43:31Z
Total formulas: 6142
Sheets: 7
Late additions: 2847 (46.4%)
── Late Additions ──
These formulas were created after cells currently below them:
#28: C11 (row 11) - SUM(C12:C26)-SUM(C27:C40)
#29: D11 (row 11) - IF(C11="","",IF(C11<>SUM(G11:Q11),"ERROR","OK"))
...Reconstructing Original Layout
Attempt to infer what the spreadsheet looked like before rows were moved:
original <- reconstruct_original(xlsx, sheet = "Income Statement")
original |> filter(was_moved) |> head(10)
# A tibble: 10 × 8
sheet_name original_row current_row cell_ref col formula was_moved movement
<chr> <int> <int> <chr> <chr> <chr> <lgl> <chr>
1 Income Statement 4 7 E7 E 'Assum… TRUE inserted
2 Income Statement 5 21 E21 E 'Assum… TRUE inserted
3 Income Statement 5 17 F17 F 'Assum… TRUE inserted
...print_original_comparison(original)── Original vs Current Layout ──
ℹ Showing inferred original positions based on creation order
Cells analyzed: 475
Cells moved: 362 (76.2%)
── Moved Cells ──
E7: row 4 -> row 7 (inserted)
E21: row 5 -> row 21 (inserted)
...Interpreting Results
This NIST file has 134,760 anomalies. Is it fraud? No.
The file was:
- Created in 2000
- Modified over 23 years
- Reorganized multiple times
- Maintained by different people
High anomaly counts are normal for working documents.
What IS Suspicious
| Pattern | Suspicion Level | Why |
|---|---|---|
| Isolated anomalies in orderly data | High | Data entry should be sequential |
| Late additions in specific result rows | High | May indicate inserted results |
| Data rows created after summary formulas | Medium | Summaries usually come last |
| Entire sections out of order | Low | Normal reorganization |
| High count in old files | Low | Expected from editing |
When calcChain Analysis Fails
- Only tracks formulas — Plain values are invisible
- No timestamps — Only relative order, not when changes occurred
- Can be circumvented — Copy/paste values or recreate file
- LibreOffice — May not write calcChain.xml
- Programmatic files — R/Python-generated files often lack calcChain
Quick Reference
| Function | Purpose |
|---|---|
parse_xlsx() |
Parse workbook into xlsx_workbook object |
detect_anomalies() |
Find cells where creation order ≠ row position |
summarize_anomalies() |
Summary stats by sheet, type, clusters |
build_timeline() |
Formula creation timeline |
print_timeline_summary() |
Formatted timeline output |
reconstruct_original() |
Infer original layout |
print_original_comparison() |
Compare original vs current |
plot_calc_order() |
Scatter plot of creation vs row |
plot_sheet_heatmap() |
Heatmap of creation order |
plot_anomalies() |
Grid showing anomaly locations |
Next Steps
- Understanding Anomalies — Deep dive into the detection algorithm
- Getting Started — Basic package usage
- Excel Formula Translation — Convert Excel formulas to R