Understanding Anomaly Detection
What is an Anomaly?
An anomaly is a cell where the creation order (position in calcChain.xml) doesn’t match the row order (current position in the spreadsheet).
Excel’s calcChain.xml records formulas in creation order. This order persists even when rows are moved. By comparing creation order to current row position, we detect manipulation.
The Detection Algorithm
For each column separately, we calculate:
order_diff = (calcChain rank) - (row rank)| order_diff | Anomaly Type | Meaning |
|---|---|---|
| > 0 | moved_up |
Cell created later than row suggests |
| < 0 | moved_down |
Cell created earlier than row suggests |
| = 0 | (normal) | Cell is in expected position |
Analysis is done per-column because formulas in different columns may have been created at different times, even within the same row. This avoids false positives from horizontal fill operations.
Worked Examples
Example 1: Normal Spreadsheet
Formulas created top-to-bottom, no manipulation:
Cell  Row  CalcChain  Row Rank  Chain Rank  Diff  Status
────────────────────────────────────────────────────────
A1    1    1          1         1           0     OK
A2    2    2          2         2           0     OK
A3    3    3          3         3           0     OK
All diffs are 0 → No anomalies.
Example 2: Row Moved Up
Original: Formulas in A1, A2, A3 created in rows 1, 2, 3. Then: Row 3’s formula moved to row 1.
Cell    Row  CalcChain  Row Rank  Chain Rank  Diff  Anomaly
───────────────────────────────────────────────────────────────
A3→A1   1    3          1         3           +2    moved_up
A1→A2   2    1          2         1           -1    moved_down
A2→A3   3    2          3         2           -1    moved_down
The moved cell (now A1, was A3) has positive diff → moved_up. The pushed cells have negative diff → moved_down. When you move one row up, the rows below are pushed down, creating a cascade of anomalies.
Example 3: Row Inserted
Original: A1, A2, A3 in rows 1, 2, 3. Then: New formula inserted at row 2 (old A2→A3, old A3→A4).
Cell  Row  CalcChain  Row Rank  Chain Rank  Diff  Anomaly
─────────────────────────────────────────────────────────────
A1    1    1          1         1           0     OK
NEW   2    4          2         4           +2    moved_up
A2    3    2          3         2           -1    moved_down
A3    4    3          4         3           -1    moved_down
The inserted row has a high calcChain order (4) but low row number (2) → moved_up.
Using detect_anomalies()
xlsx <- parse_xlsx("nist_financial_model.xlsx")
anomalies <- detect_anomalies(xlsx)
head(anomalies)
# A tibble: 6 × 9
sheet_name cell_ref row col col_num calc_order expected_order order_diff anomaly_type
<chr> <chr> <int> <chr> <int> <int> <int> <int> <chr>
1 Depreciation Schedule F154 154 F 6 1 2641 -2640 moved_down
2 Depreciation Schedule G154 154 G 7 2 2642 -2640 moved_down
3 Depreciation Schedule H154 154 H 8 3 2643 -2640 moved_down
4 Depreciation Schedule I154 154 I 9 4 2644 -2640 moved_down
5 Depreciation Schedule J154 154 J 10 5 2645 -2640 moved_down
6 Depreciation Schedule K154 154 K 11 6 2646 -2640 moved_downThese cells in row 154 were created first (calc_order 1-6) but are currently at the bottom of the sheet. This means ~2,640 rows were added above them over time.
Using the Threshold Parameter
The threshold parameter filters out minor discrepancies:
# Default: all anomalies
anomalies_all <- detect_anomalies(xlsx)
nrow(anomalies_all)
[1] 134760# Only flag cells 5+ positions out of order
anomalies_strict <- detect_anomalies(xlsx, threshold = 5)
nrow(anomalies_strict)[1] 134508Use a higher threshold when:
- Analyzing files with many minor edits
- Looking for significant structural changes
- Reducing noise in visualization
Keep threshold at 0 (default) when:
- Analyzing files suspected of fraud
- Every anomaly matters
- Building detailed timelines
Summarizing Results
summary_result <- summarize_anomalies(anomalies, xlsx)
print(summary_result)
── Anomaly Summary ──
ℹ Severity: high
Total anomalous cells: 134760
── By Sheet ──
# A tibble: 7 × 2
sheet_name n
<chr> <int>
1 Depreciation Schedule 71691
2 Assumptions Processing 18438
3 CashFlow 16086
4 Income Statement 13293
5 Balance Sheet 11529
6 Control Panel 3717
7 Overview 6
── By Type ──
# A tibble: 2 × 2
anomaly_type n
<chr> <int>
1 moved_up 68770
2 moved_down 65990
── Row Clusters ──
Groups of consecutive rows that may have been moved together:
# A tibble: 70 × 4
sheet_name start_row end_row n_cells
<chr> <int> <int> <int>
1 Depreciation Schedule 4 4 437
2 Depreciation Schedule 11 16 2760
...Severity Levels
| Severity | Criteria |
|---|---|
none |
No anomalies |
low |
Few anomalies, likely normal editing |
medium |
>5% of cells or >50 anomalies |
high |
>20% of cells anomalous |
Row Clusters
The row_clusters field identifies consecutive rows that may have been moved together. Large clusters suggest structural reorganization; isolated single rows are more suspicious.
Visual Interpretation Guide
Scatter Plot Patterns
plot_calc_order(xlsx, sheet = "Income Statement")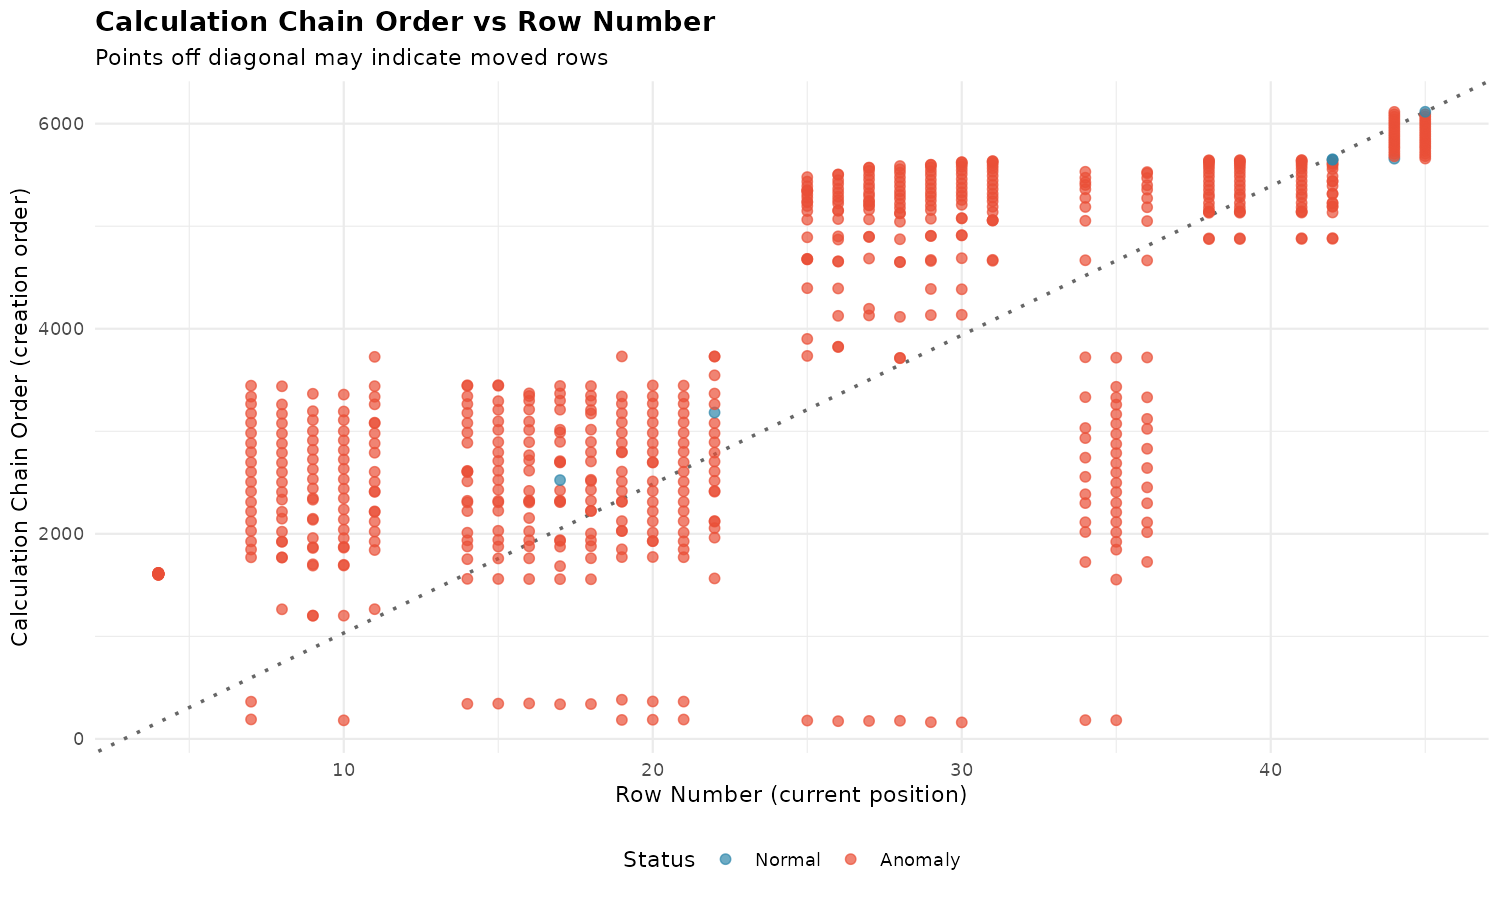
| Pattern | Interpretation |
|---|---|
| Points on diagonal | Normal: creation matches row order |
| Points above diagonal | Created later than row suggests |
| Points below diagonal | Created earlier than row suggests |
| Vertical spread | Column has mixed creation times |
| Horizontal bands | Rows added in batches |
| Scattered cloud | Heavy editing over time |
Heatmap Patterns
plot_sheet_heatmap(xlsx, sheet = "Income Statement")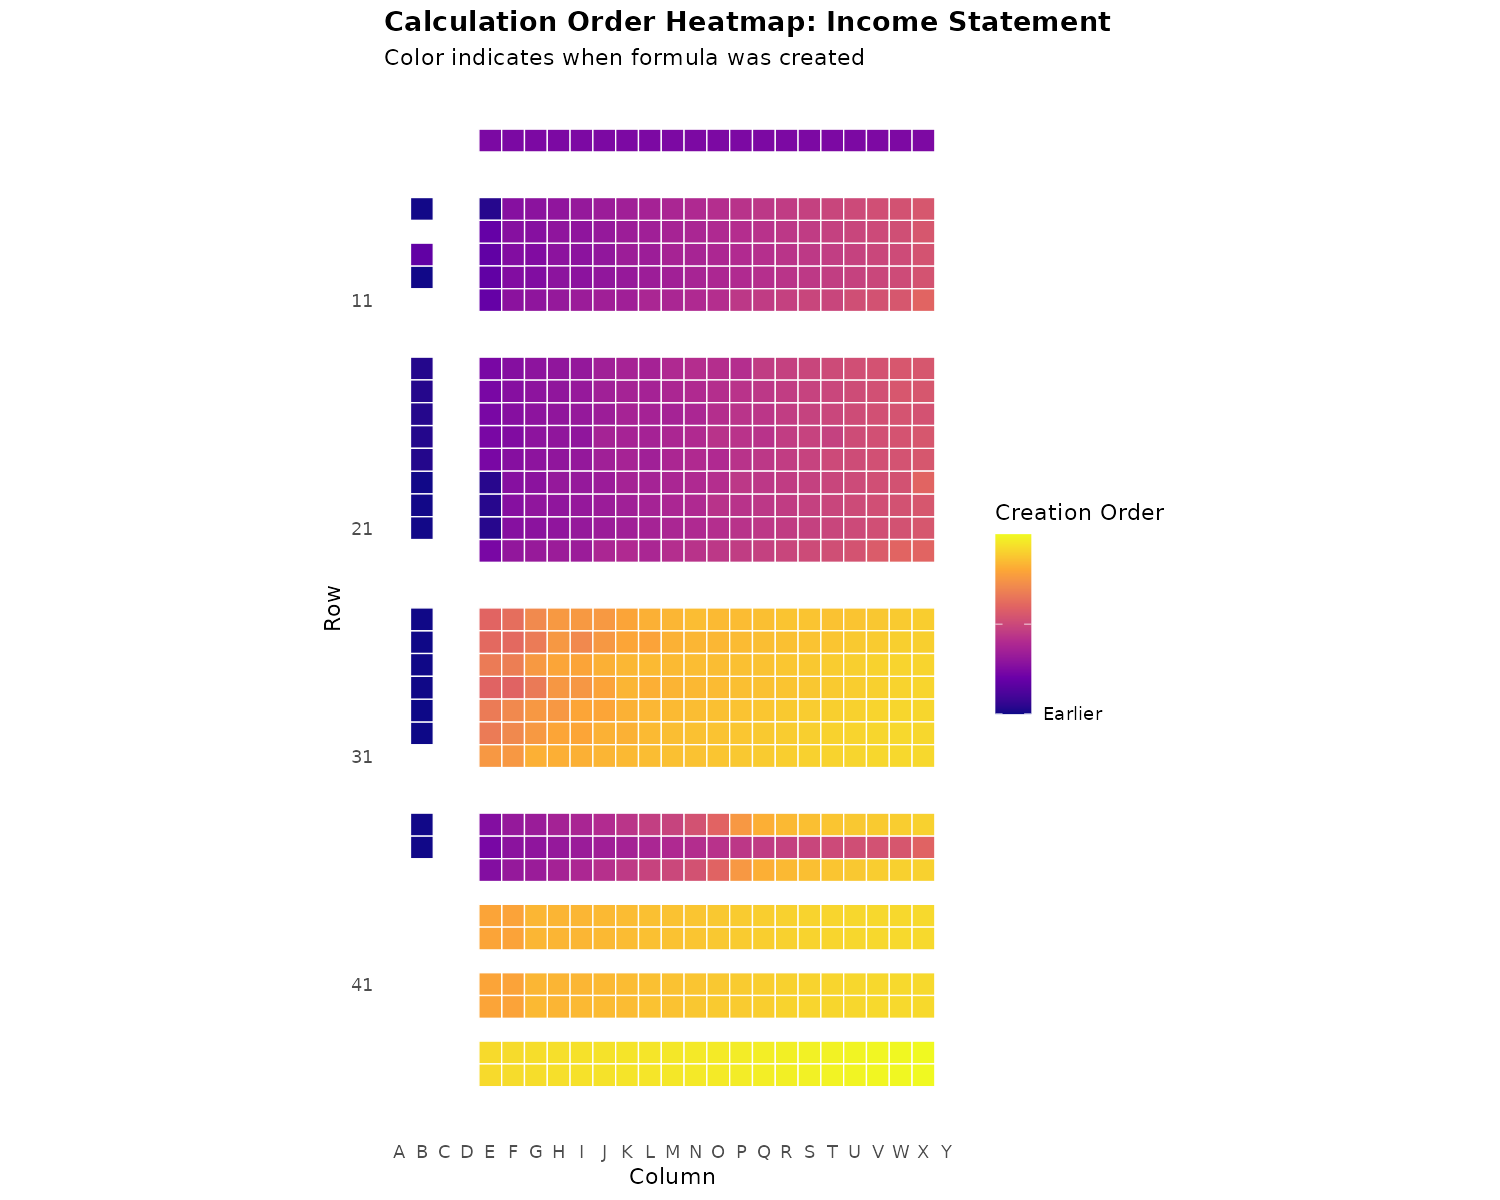
| Pattern | Interpretation |
|---|---|
| Uniform color | Cells created together |
| Top→bottom gradient | Normal sequential creation |
| Color bands | Rows added in batches |
| Yellow in purple area | Late insertion (suspicious) |
| Checkerboard | Heavy cell-by-cell editing |
Limitations
- Plain values — Only formula cells are tracked
- Absolute timestamps — Only relative order is known
- Circumvention — Copy/paste values or recreate file
- Cross-column patterns — Analysis is per-column
- Intent — Cannot distinguish error from fraud
When to Be Suspicious
High Suspicion
- Isolated late additions in data entry sections
- Result cells created before input cells
- Specific rows inserted into otherwise sequential data
- Small clusters of anomalies in otherwise clean data
Low Suspicion
- High anomaly count in old files
- Entire sections out of order (reorganization)
- Header/footer rows created last
- Consistent patterns across similar sheets
Next Steps
- Forensic Analysis — Complete forensic workflow
- Getting Started — Basic package usage
- Excel Formula Translation — Convert Excel formulas to R