# Sample data
df <- data.frame(
    product = c("Apples", "Oranges", "Bananas", "Grapes"),
    sales = c(120, 85, 95, 110)
)

# Highlight only the winner
fill_colors <- highlight_colors(
    df$product,
    highlight = c("Apples" = "#E63946")
)

# Create the base chart
p <- ggplot(df, aes(x = reorder(product, sales), y = sales, fill = product)) +
    geom_col(width = 0.7) +
    coord_flip() +
    scale_fill_manual(values = fill_colors, guide = "none") +
    scale_y_continuous(expand = expansion(mult = c(0, 0.1))) +
    theme_stwd() +
labs(x = NULL, y = "Units Sold")Introduction to stwd
What is stwd?
The stwd package provides tools for creating presentation-ready visualizations following Storytelling with Data principles. It helps you build complete “story layouts” that combine charts with narrative text, colored titles, and supporting context.
Key Features
The package includes:
- Story Designer - Interactive Shiny app for designing layouts with real-time preview
- Block Functions - Modular components (title, subtitle, narrative, caption) for patchwork composition
- Legend Block - Inline colored text legends embedded in the layout
- Highlight Colors - Strategic color use (gray out noise, highlight signal)
- Marquee Integration - Color-matched text in titles and labels
The STWD Approach
Traditional charts put the burden on the reader to interpret meaning. Storytelling with Data (SWD) charts guide the reader by:
- Highlighting what matters - Gray out the noise, color the signal
- Embedding the legend in the title - No separate legend box needed
- Adding narrative context - Explain the “so what?” alongside the chart
- Using a clear visual hierarchy - Big title, supporting chart, explanatory text
Workflow
The stwd workflow is:
- Create your plot with ggplot2
- Design interactively with
story_designer() - Copy the generated code from the Code tab
- Paste into your Quarto document
Quick Start
Step 1: Create Your Plot
Step 2: Launch the Designer
story_designer(plot = p)The designer lets you:
- Add and customize title, subtitle, narrative, caption
- Adjust font sizes, alignment, spacing
- Apply color palettes or manual colors
- Preview at actual export size
- Copy the generated code
Step 3: Use the Generated Code
The designer generates patchwork code like this:
# Block components
title_plot <- title_block(
    "**Q4 Sales: {#E63946 Apples} Take the Lead**",
    title_size = 12
)

subtitle_plot <- subtitle_block(
    "Fruit category performance, October-December 2024",
    subtitle_size = 10
)

narrative_plot <- text_narrative(
    "**Key takeaway:**

{#E63946 Apples} outsold all other fruits
this quarter, driven by seasonal demand
and promotional pricing.

**Recommendation:** Increase apple
inventory for Q1.",
    size = 10
)

caption_plot <- caption_block(
    "Source: Internal Sales Database",
    caption_size = 8
)

# Combine with patchwork
content <- p + narrative_plot + plot_layout(widths = c(0.65, 0.35))
title_plot / subtitle_plot / content / caption_plot +
    plot_layout(heights = c(0.08, 0.05, 0.82, 0.05))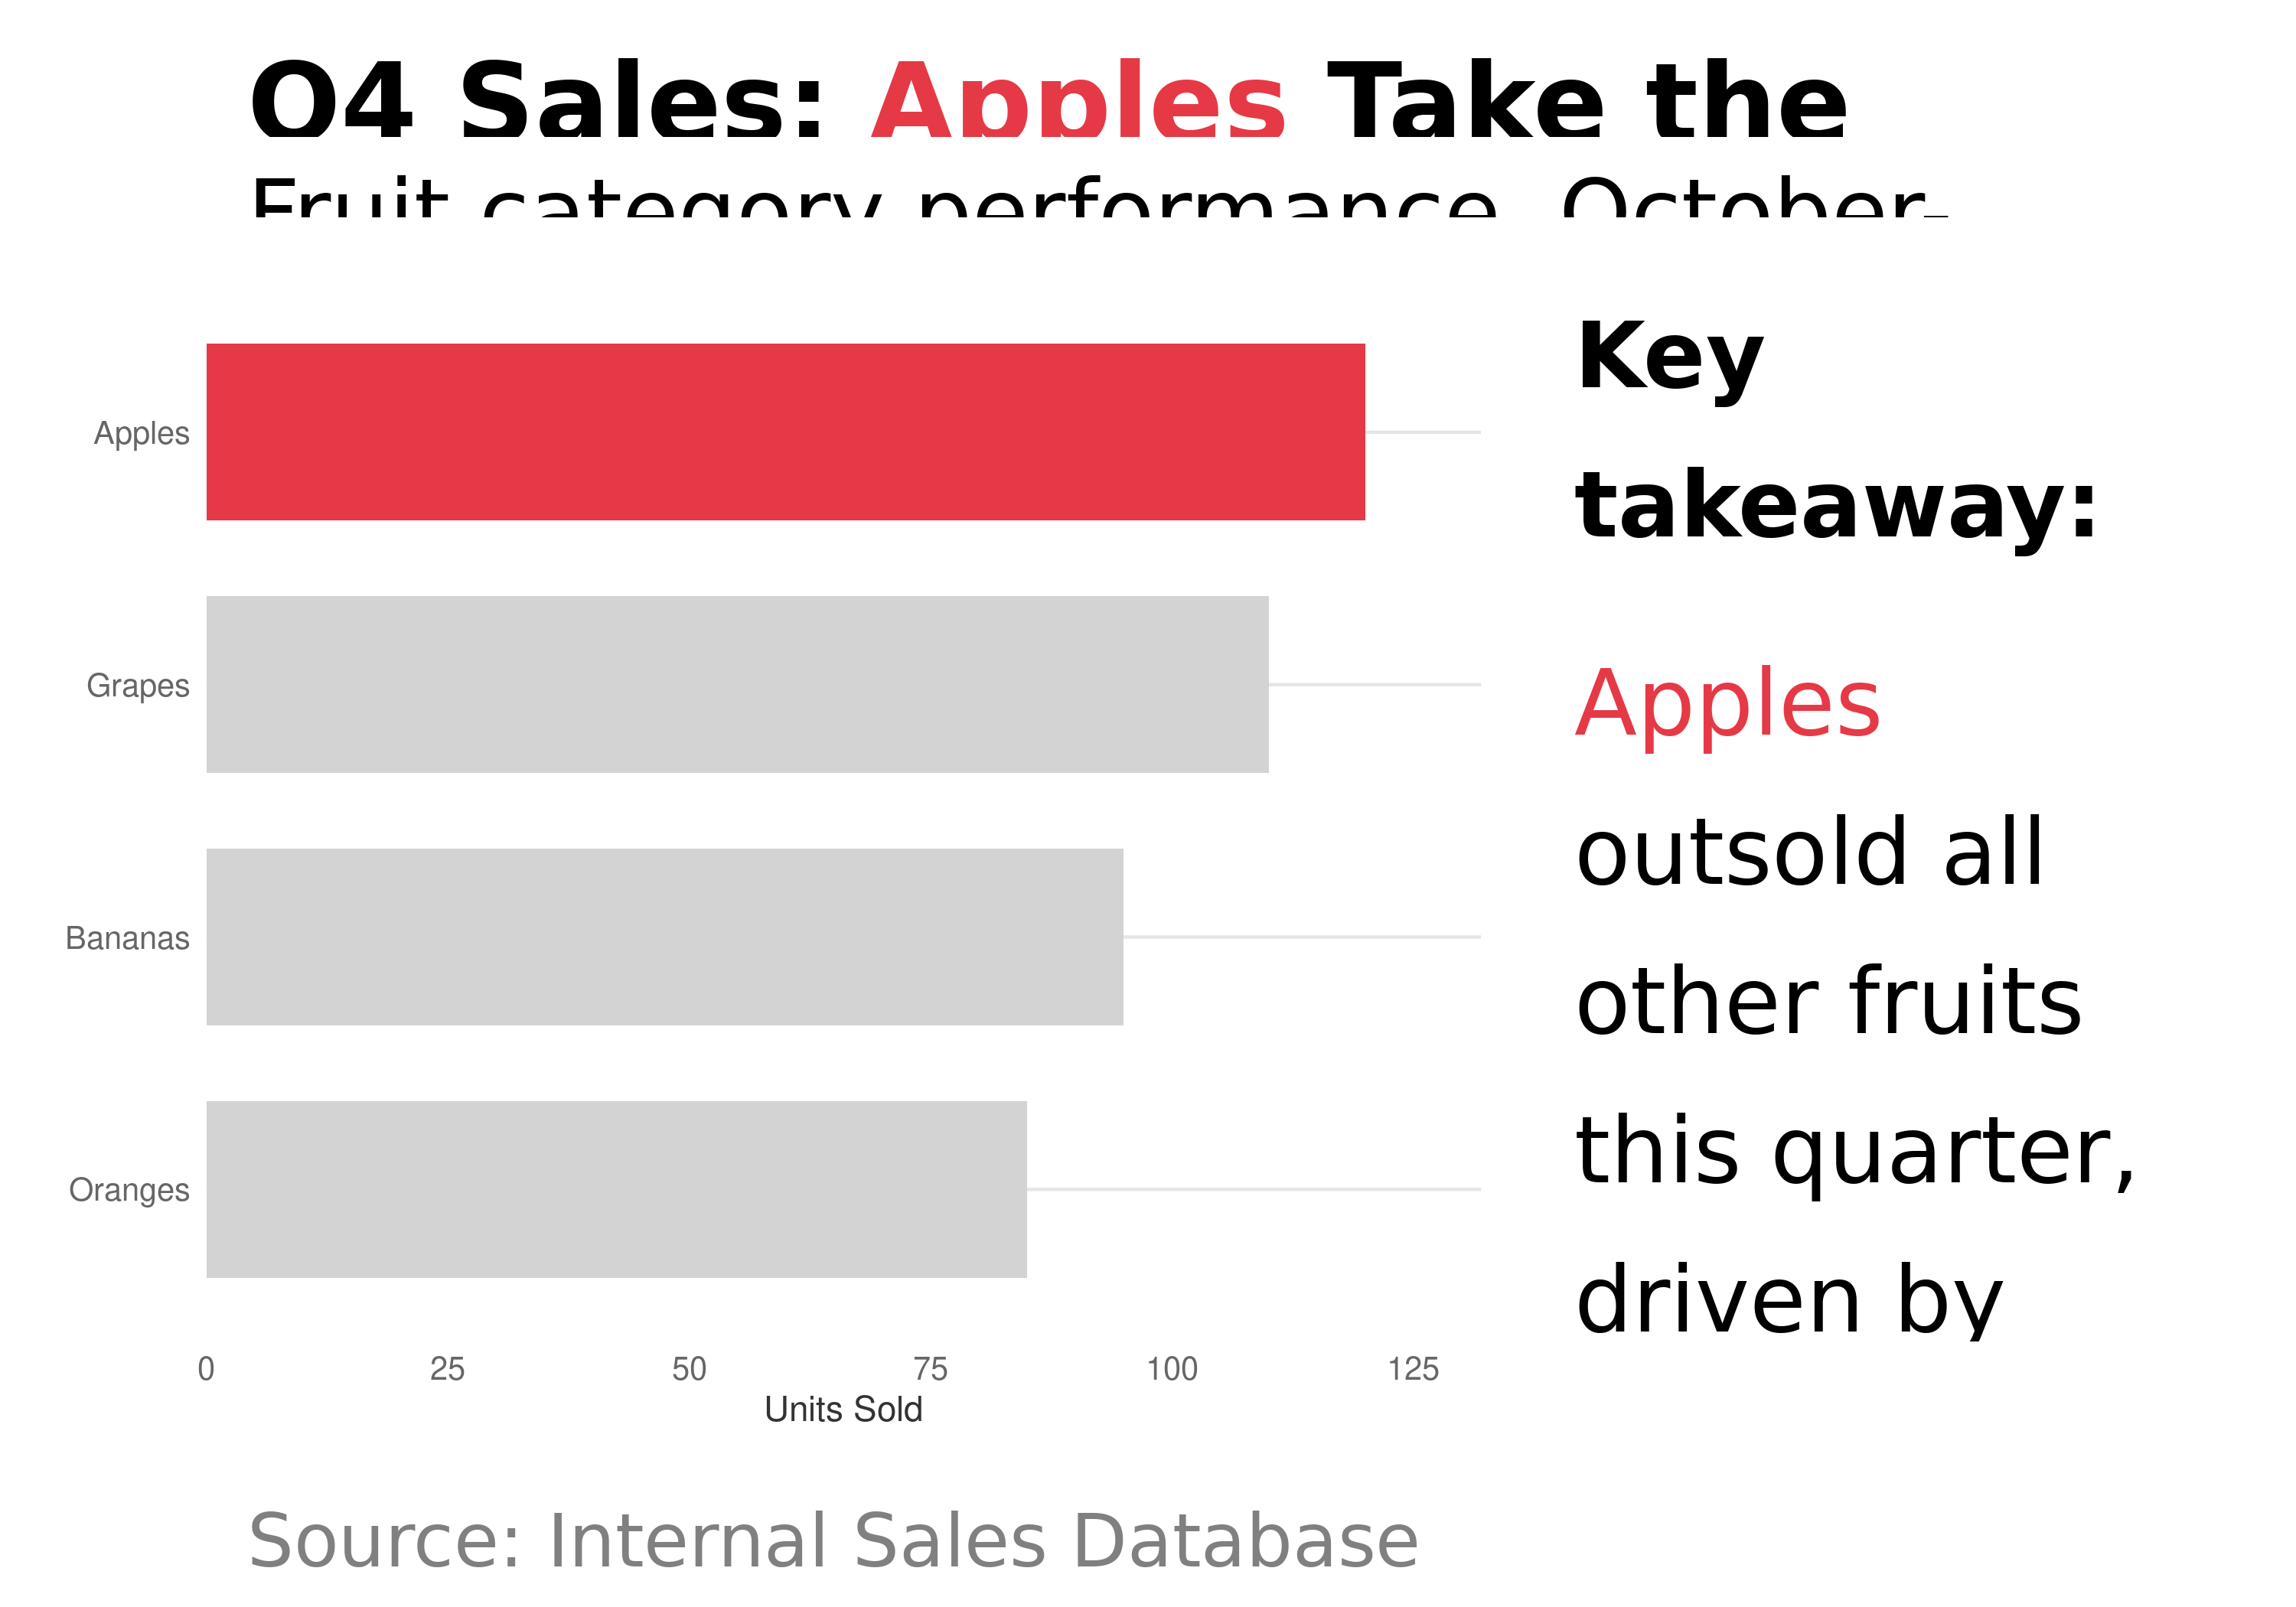
Story Designer Features
Text Controls:
- Title, subtitle, narrative, caption with marquee formatting
- Font size, alignment, line height, wrap width
Legend Block:
- Inline colored text legend (e.g., “HIGH | MEDIUM | LOW”)
- Position above, below, left, or right of chart
Color Palettes:
- 9 palette packages: ggsci, MetBrewer, nord, PNWColors, rcartocolor, RColorBrewer, scico, viridis, wesanderson
- Click swatches to select specific colors
- Apply to fill, color, or both
Manual Colors:
- Set a default color (gray) for unassigned categories
- Assign specific colors to highlight key categories
- Perfect for the SWD approach: gray the noise, color the signal
Validate & Export:
- Preview at actual export dimensions
- PNG, PDF, or SVG export
- Copy generated patchwork code
Inline Legends with legend_block()
Instead of a separate legend box, embed the legend in your layout:
legend_colors <- c("HIGH" = "#E63946", "MEDIUM" = "#808080", "LOW" = "#457B9D")

title_block("Performance by Category") /
  legend_block(legend_colors, halign = "right") /
  p /
  caption_block("SOURCE: Internal Data") +
  plot_layout(heights = c(0.08, 0.04, 0.83, 0.05))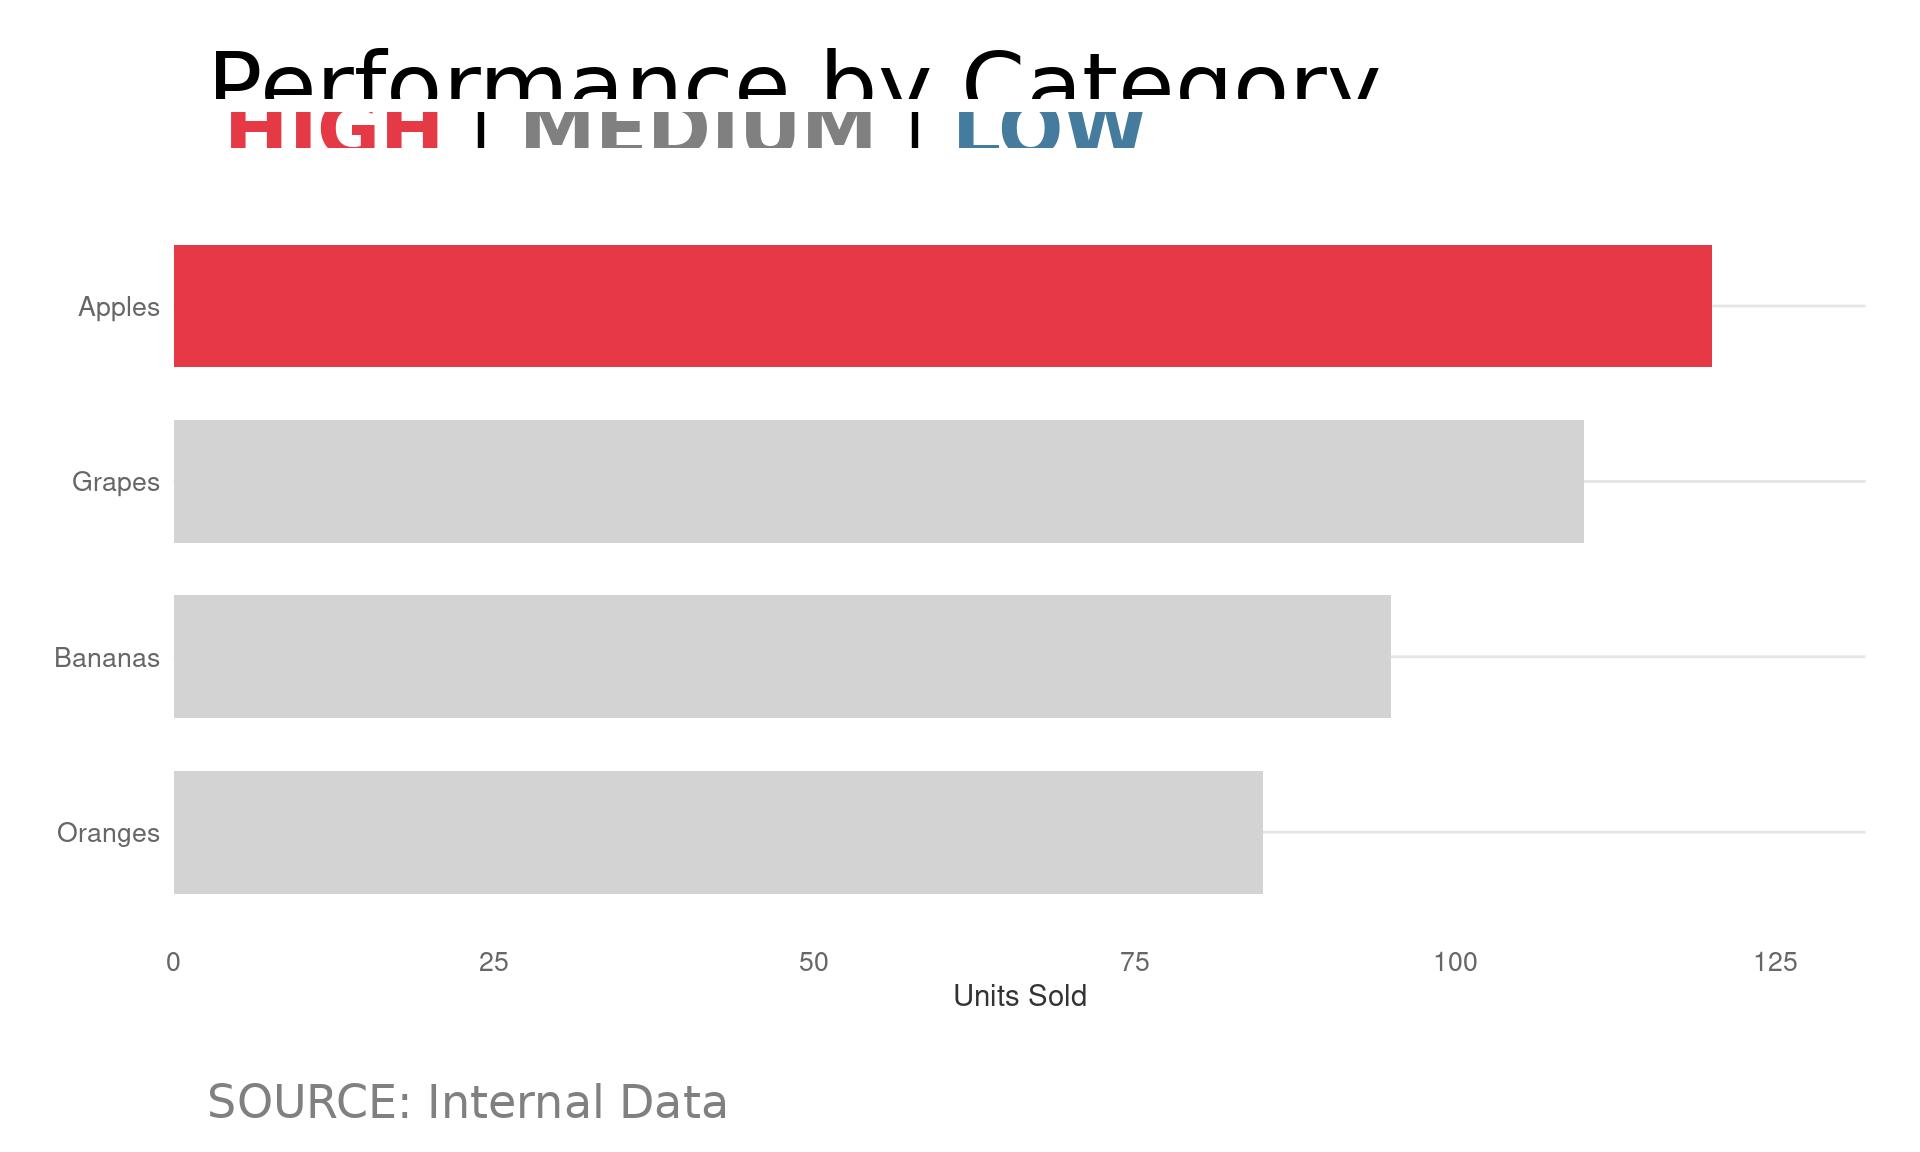
Learn More
- Storytelling Layouts - Complete guide to story layouts
- Sizing Guide - Matching Quarto dimensions to Story Designer
- Marquee Integration - Colored text labels