title_block(
    "**Q4 Sales: {#E63946 Apples} Take the Lead**",
    title_size = 10
)
The stwd package provides block functions for building presentation-ready story layouts. Use story_designer() to interactively design layouts, then copy the generated patchwork code.
Creates a large, prominent title. Supports marquee syntax for colored text.
title_block(
"**Q4 Sales: {#E63946 Apples} Take the Lead**",
title_size = 10
)
Adds supporting context below the title.
subtitle_block(
    "{#2A9D8F Revenue} up 15% | {#E63946 Costs} down 3%",
    subtitle_size = 10
)
Creates a text panel for the “so what?” explanation.
text_narrative(
    text = "**Key insight:**
        {#E63946 Strong growth} in core markets.",
    size = 10
)
Adds source attribution at the bottom.
caption_block("Source: Finance Department | Q4 2024", caption_size = 6)
Creates an inline colored text legend instead of a traditional legend box.
legend_colors <- c("HIGH" = "#E63946", "MEDIUM" = "#808080", "LOW" = "#457B9D")

legend_block(legend_colors, halign = "right", sep = " | ")
Stack blocks vertically with / and set proportional heights:
df <- data.frame(x = c("A", "B", "C"), y = c(30, 50, 20))

chart <- ggplot(df, aes(x, y, fill = x)) +
    geom_col() +
    scale_fill_manual(values = c(A = "#E63946", B = "#CCCCCC", C = "#CCCCCC"),
                      guide = "none") +
    theme_minimal() +
    labs(x = NULL, y = NULL)

title_block("**{#E63946 Category A} Leads**", title_size = 12) /
subtitle_block("Year-over-year comparison", subtitle_size = 10) /
chart /
caption_block("Source: Internal Analytics") +
    plot_layout(heights = c(0.08, 0.06, 0.78, 0.08))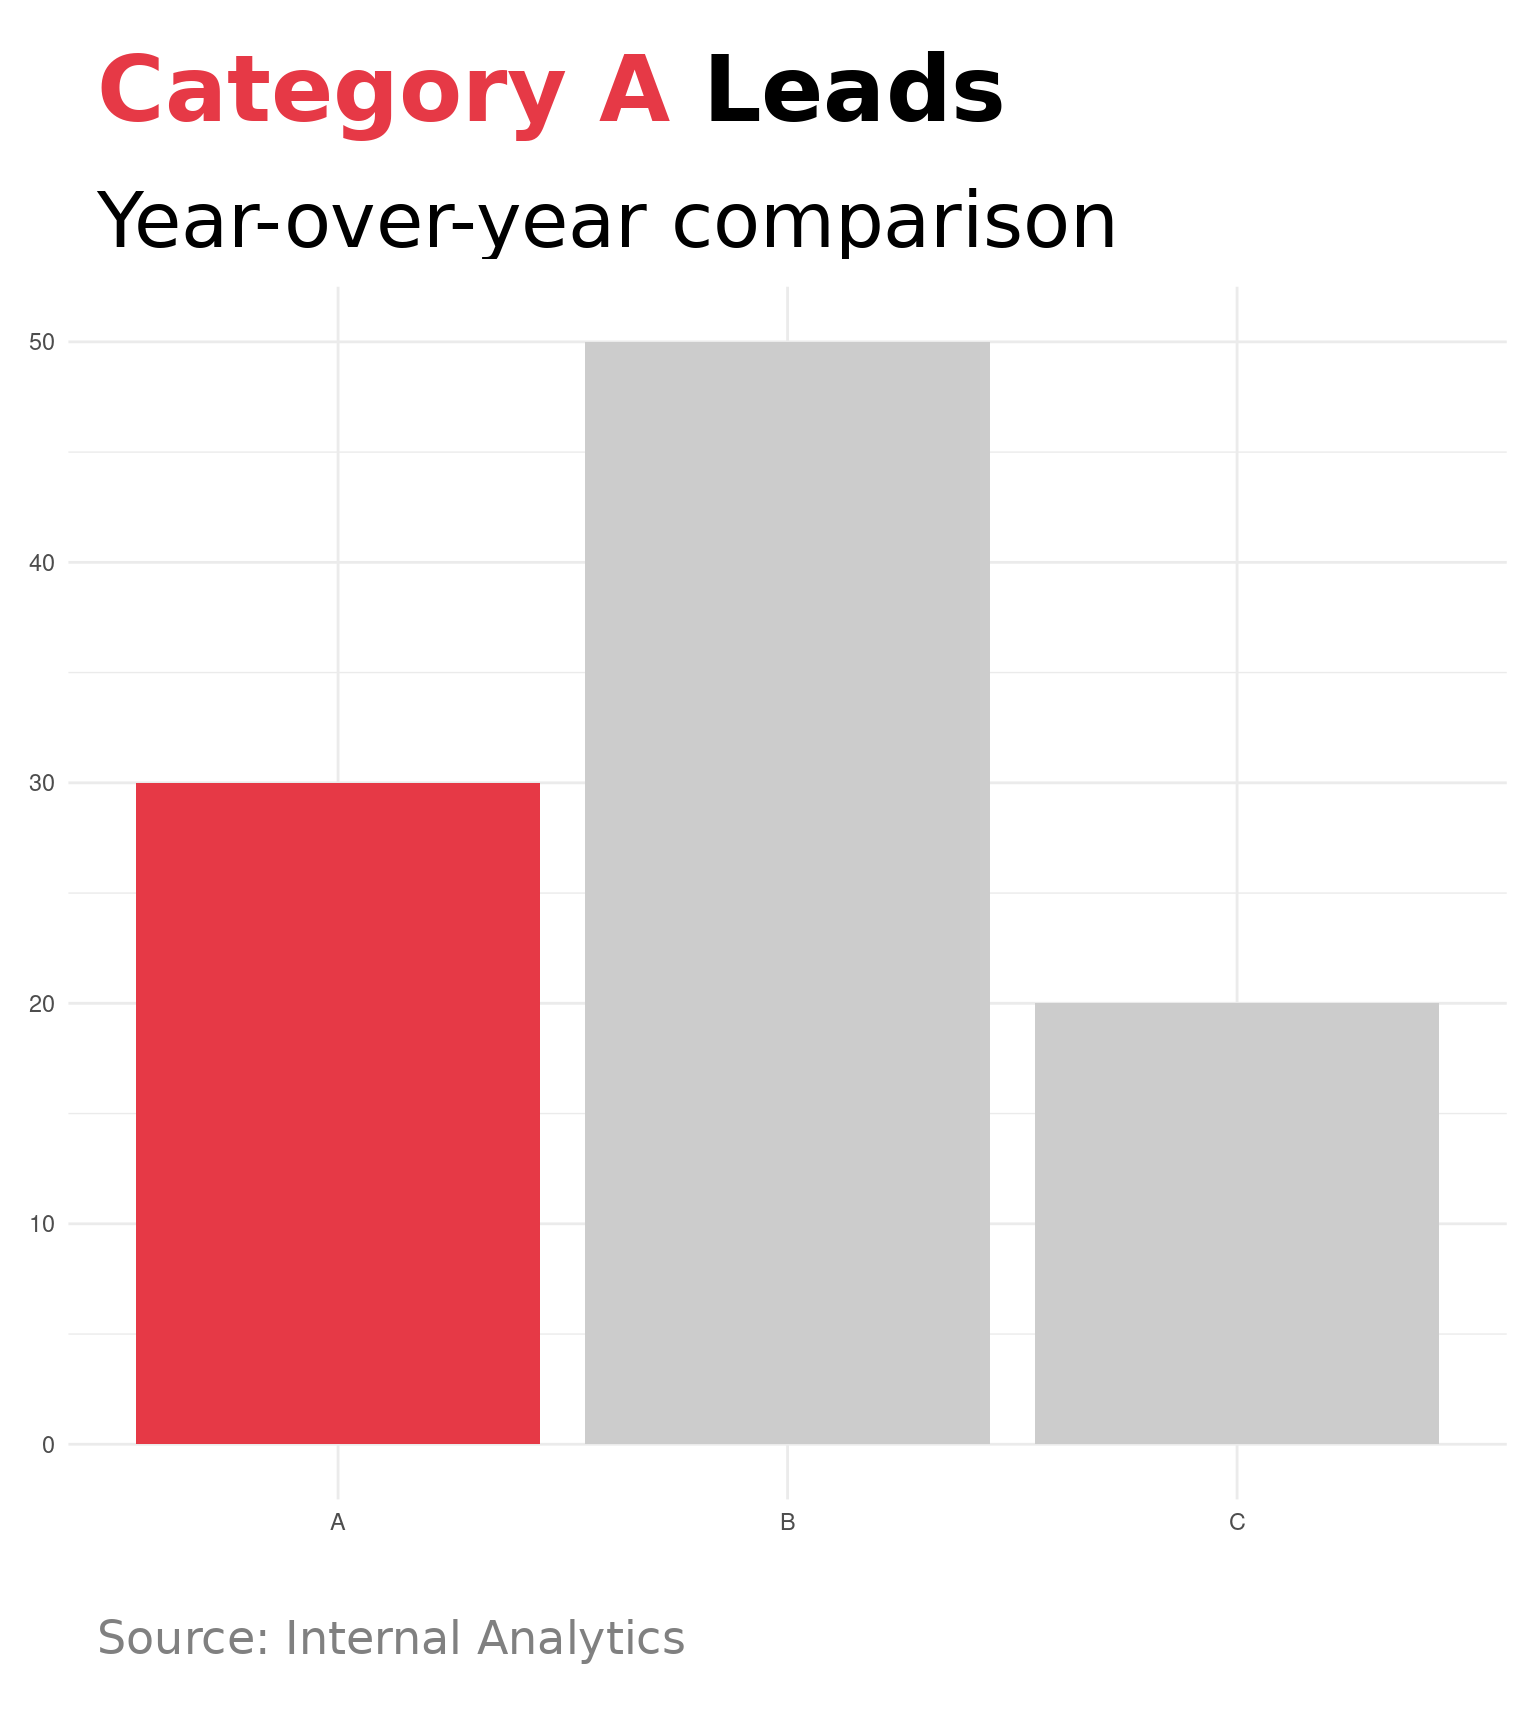
Place chart and narrative side by side with + and set proportional widths:
narrative <- text_narrative(
    "**Summary:**

{#E63946 Category A} leads with 50 units.",
    size = 8
)

content <- chart + narrative + plot_layout(widths = c(0.65, 0.35))

title_block("**{#E63946 Category A} Leads**", title_size = 12) /
subtitle_block("Year-over-year comparison", subtitle_size = 10) /
content /
caption_block("Source: Internal Analytics") +
    plot_layout(heights = c(0.08, 0.06, 0.78, 0.08))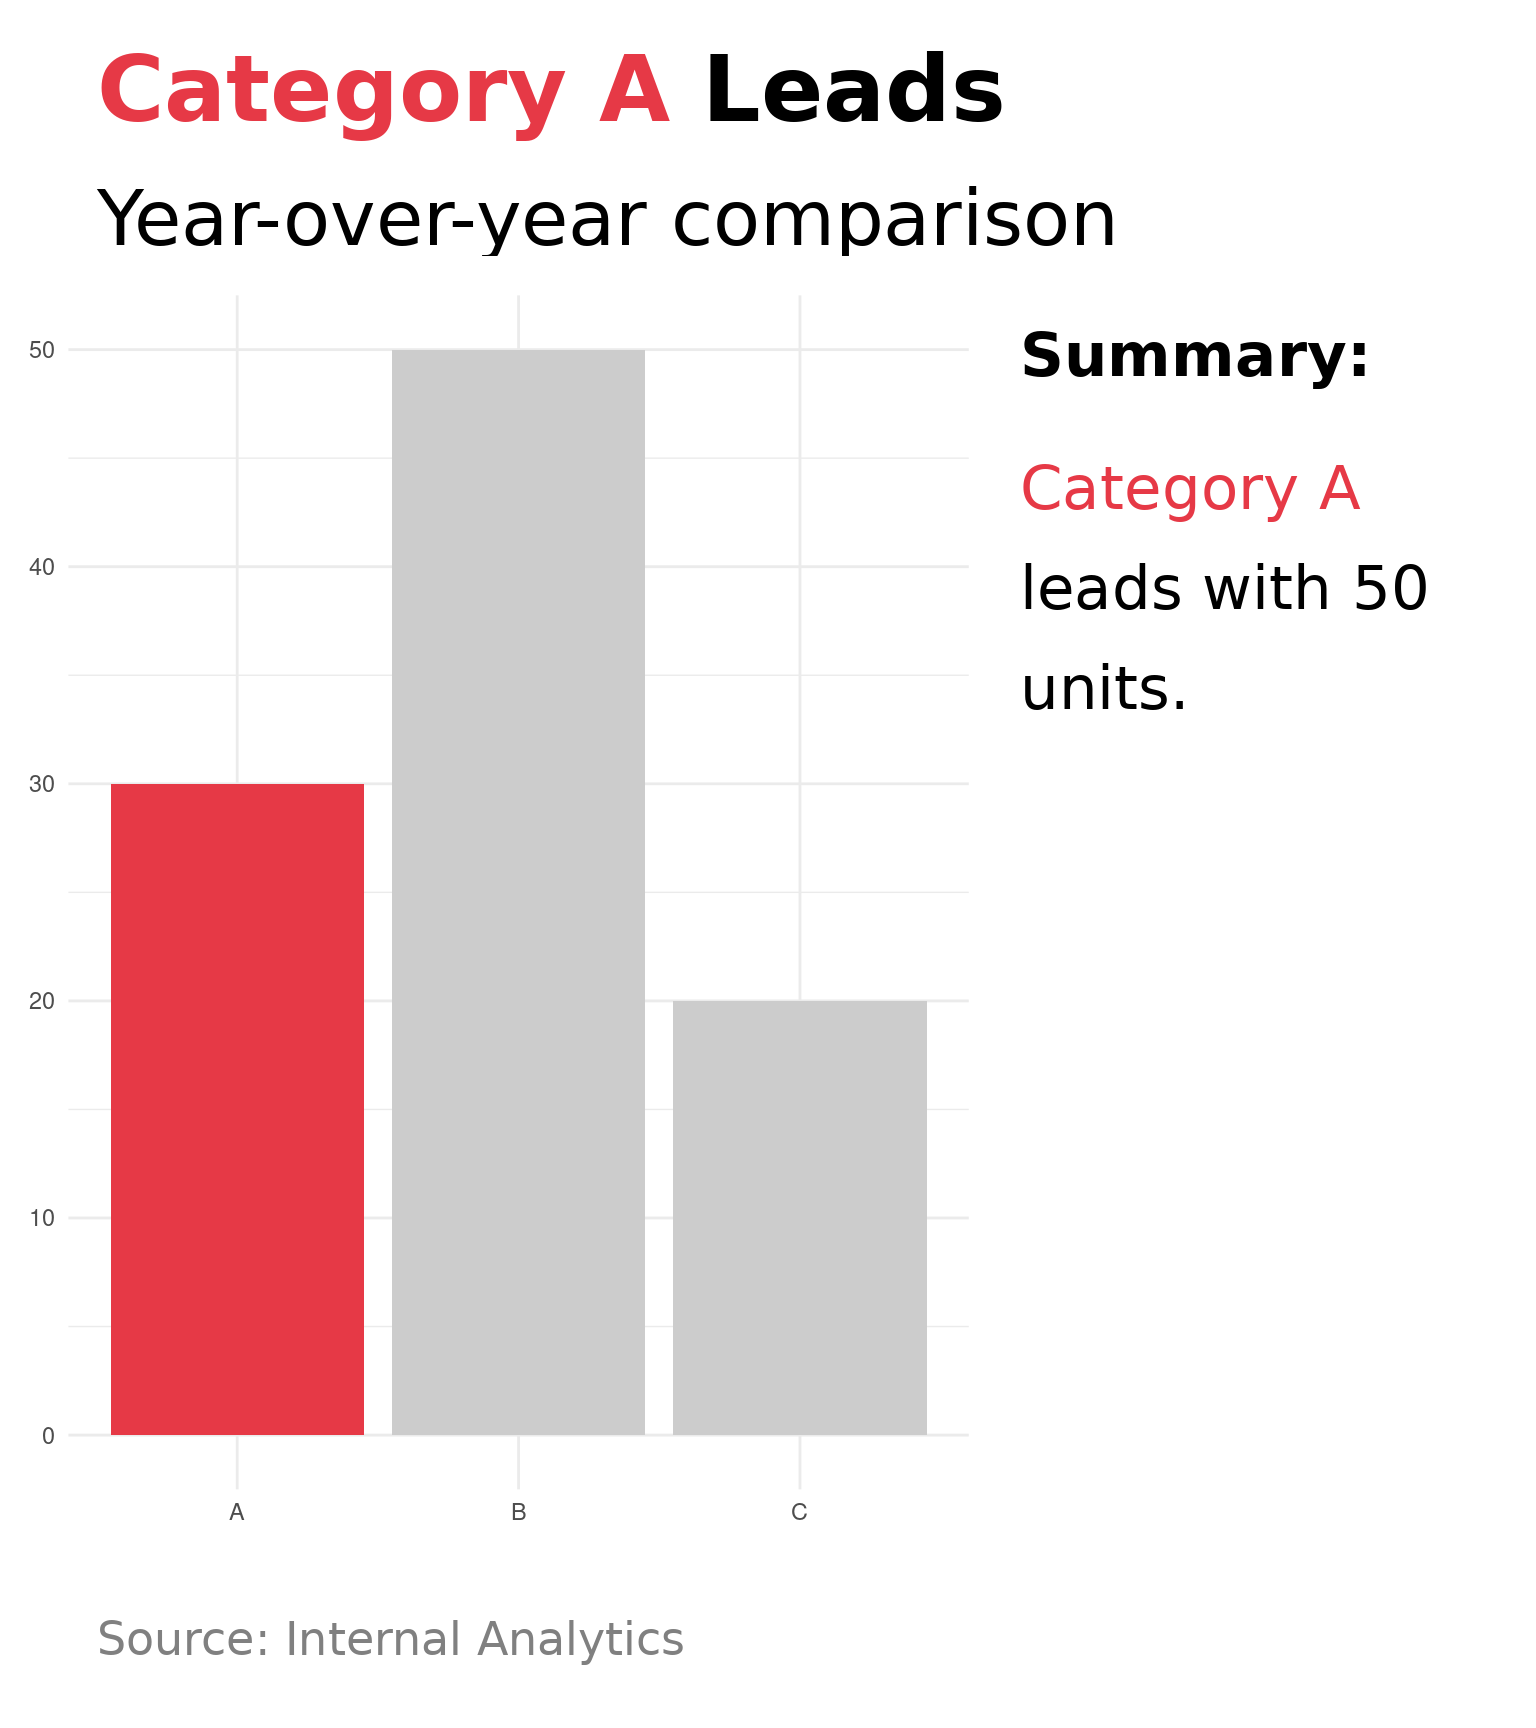
| Function | Purpose |
|---|---|
highlight_colors() |
Gray out non-essential categories |
theme_stwd() |
Clean SWD theme (horizontal grid only) |
story_designer(plot = p)fig-width, fig-height, fig-dpiSee the Sizing Guide for details on matching dimensions.